Project Description
The purpose of this project was to visualize the structure of a film, which put to the test our ability to accurately represent large amounts of complex data in a visually appealing and organized fashion. The movies that were chosen (Run Lola Run, Inception & Groundhog Day) all have some form of time looping woven into the structure of the timeline which presented us with significant challenges, but also with interesting ways to depict the information. Multiple layers of interconnected data was to be shown including overall timeline, characters and their relationships, symbolism, and soundtrack.
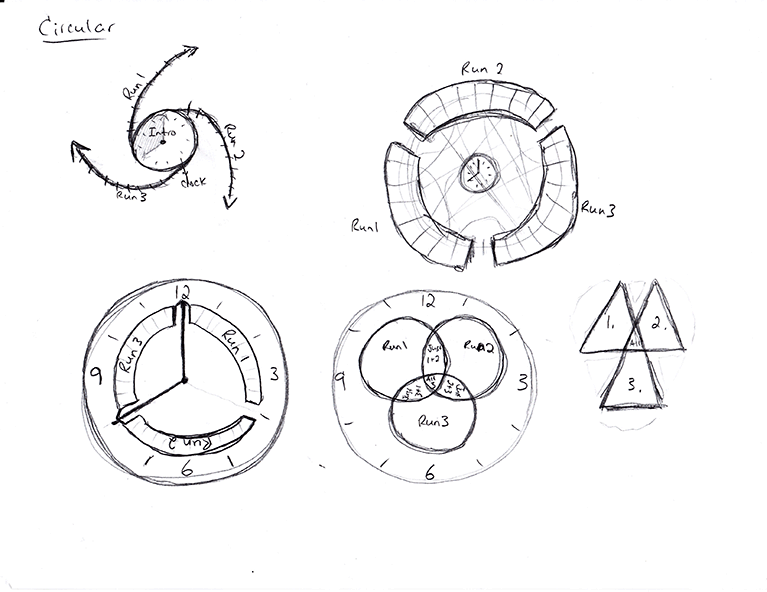
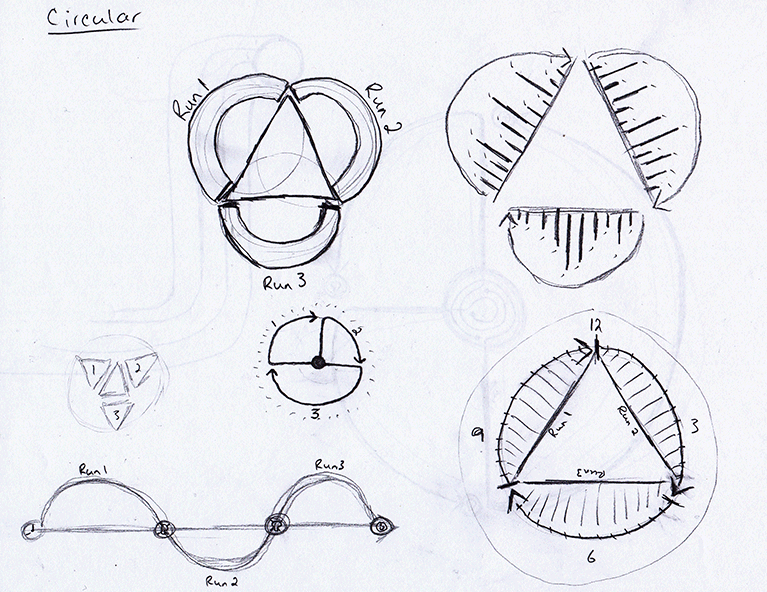
In this particular movie, the main character, Lola, has to come up with $100 000 in just 20 minutes to save her boyfriends life. She goes through a series of 3 different "runs", all with different outcomes depending on minor changes in events along the way. The structure for this diagram relies heavily on the symbolism of the clock used in the film, which is why I used a circular format divided into 3 main sections to represent the three 20 minute runs. The colours of the runs correlate to Lola's outfit in the film. The timeline starts at the center and moves clockwise around the circle, ending at the final outcome, depicted here as a smiley face icon.
Tools Used


